import math, random
from pyx import *
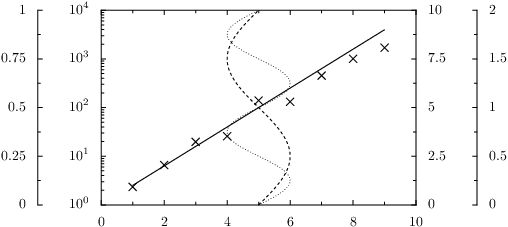
g = graph.graphxy(width=8, y=graph.axis.log(), y2=graph.axis.lin(),
y3=graph.axis.lin(min=0, max=1),
y4=graph.axis.lin(min=0, max=2))
d = [[i, math.exp(0.8*i+random.random())] for i in range(1,10)]
f = lambda x, a: x*a
g.plot(graph.data.points(d, x=1, y=2))
g.plot(graph.data.function("y2(x)=f(x, 1)", context=locals()))
g.plot(graph.data.function("x(y3)=5+sin(2*pi*y3)"))
g.plot(graph.data.function("x(y4)=5+sin(2*pi*y4)"))
g.writeEPSfile()
g.writePDFfile()
g.writeSVGfile()
