from pyx import *
from pyx.graph import graphxy, data, axis
from pyx.graph.axis import painter, tick
from pyx.deco import earrow
range = 2.5
p = painter.regular(basepathattrs=[earrow.normal], titlepos=0.95,
outerticklength=painter.ticklength.normal,
titledist=-0.3, titledirection=None) g = graphxy(width=10, xaxisat=0, yaxisat=0,
x=axis.linear(title="$x$", min=-range, max=+range, painter=p,
manualticks=[tick.tick(0, None, None),
tick.tick(range, None, None)]),
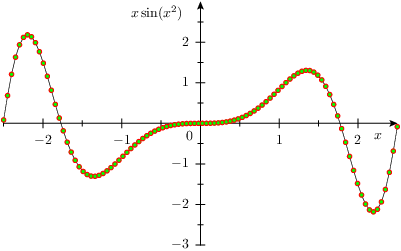
y=axis.linear(title=r"$x\sin(x^2)$", painter=p,
manualticks=[tick.tick(0, None, None),
tick.tick(3, None, None)]))
g.plot(data.function("y(x)=x*sin(x**2)"),
[graph.style.line([style.linewidth.Thin, style.linestyle.solid]),
graph.style.symbol(graph.style.symbol.circle, size=0.1,
symbolattrs=[deco.filled([color.rgb.green]),
deco.stroked([color.rgb.red])])])
g.dolayout()
x0, y0 = g.pos(0, 0)
g.text(x0 - 0.2, y0 - 0.2, "0", [text.halign.right, text.valign.top])
g.writeEPSfile()
g.writePDFfile()
g.writeSVGfile()

