
PyX — Gallery: misc/cube.py
cube
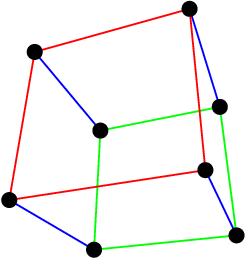
from itertools import product, combinations
from operator import eq
from pyx import *

projector = graph.graphxyz.central(10, 20, -30).point

a = 2
cube = list(product([-a, a], repeat=3))
edges = list(filter(lambda edge: sum(map(eq, edge[0], edge[1])) == 2,
                    combinations(cube, 2)))

c = canvas.canvas()

for begin, end in edges:
    x1, y1 = projector(*begin)
    x2, y2 = projector(*end)
    if begin[0] != end[0]:
        col = color.rgb.blue
    elif begin[0] == a:
        col = color.rgb.red
    else:
        col = color.rgb.green
    c.stroke(path.line(x1, y1, x2, y2), [style.linewidth.Thick, col])

for vertex in cube:
    x, y = projector(*vertex)
    c.fill(path.circle(x, y, 0.2))

c.writeEPSfile()
c.writePDFfile()
c.writeSVGfile()
Description
The 3d graphs in PyX use projectors to transform the 3d data to two dimensions. Those projectors can be used for other drawing tasks as well, as shown for a simple cube here. In addition to the central projection, a parallel projection is available, too.
Idea and initial version by Gert-Ludwig Ingold.