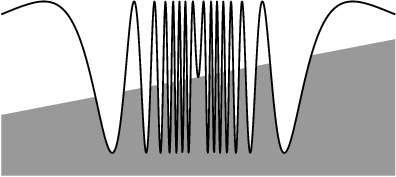
from pyx import *
xax = graph.axis.linear(min=-1, max=1.0, painter=None)
yax = graph.axis.linear(min=-1.3, max=1.3, painter=None)
g = graph.graphxy(width=10, ratio=2, x=xax, y=yax)
pifline = g.plot(graph.data.function("y(x)=sin(1.0/(x**2+0.02122))", points=1000))
pihoriz = g.plot(graph.data.function("y(x)=0.5*x", points=2))
g.finish()
fline = pifline.path
horiz = pihoriz.path
splith, splitf = horiz.intersect(fline)
area = horiz.split([splith[0]])[0]
for i in range(0, len(splith)-2, 2):
area = area.joined(fline.split([splitf[i], splitf[i+1]])[1])
area = area.joined(horiz.split([splith[i+1], splith[i+2]])[1])
area = area.joined(fline.split([splitf[-2], splitf[-1]])[1])
area = area.joined(horiz.split([splith[-1]])[1])
area.append(path.lineto(*g.vpos(1, 0)))
area.append(path.lineto(*g.vpos(0, 0)))
area.append(path.closepath()) c = canvas.canvas()
c.fill(area, [color.gray(0.6)])
c.stroke(fline, [style.linewidth.Thick, style.linejoin.round])
c.writeEPSfile()
c.writePDFfile()
c.writeSVGfile()

