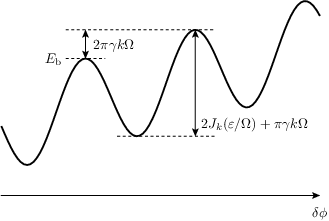
from math import pi, cos
from pyx import *
from pyx.deco import barrow, earrow
from pyx.style import linewidth, linestyle
from pyx.graph import graphxy
from pyx.graph.axis import linear
from pyx.graph.axis.painter import regular
from pyx.graph.style import line
from pyx.graph.data import function
mypainter = regular(basepathattrs=[earrow.normal], titlepos=1)
def mycos(x): return -cos(x)+.10*x
g = graphxy(height=5, x2=None, y2=None,
x=linear(min=-2.5*pi, max=3.3*pi, parter=None,
painter=mypainter, title=r"$\delta\phi$"),
y=linear(min=-2.3, max=2, painter=None))
g.plot(function("y(x)=mycos(x)", context=locals()),
[line(lineattrs=[linewidth.Thick])])
g.finish()
x1, y1 = g.pos(-pi+.1, mycos(-pi+.1))
x2, y2 = g.pos(-.1, mycos(-.1))
x3, y3 = g.pos(pi+.1, mycos(pi+.1))
g.stroke(path.line(x1-.5, y1, x1+.5, y1), [linestyle.dashed])
g.stroke(path.line(x1-.5, y3, x3+.5, y3), [linestyle.dashed])
g.stroke(path.line(x2-.5, y2, x3+.5, y2), [linestyle.dashed])
g.stroke(path.line(x1, y1, x1, y3), [barrow.normal, earrow.normal])
g.stroke(path.line(x3, y2, x3, y3), [barrow.normal, earrow.normal])
g.text(x1+.2, 0.5*(y1+y3), r"$2\pi\gamma k\Omega$", [text.vshift.middlezero])
g.text(x1-.6, y1-.1, r"$E_{\rm b}$", [text.halign.right])
g.text(x3+.15, y2+.20, r"$2J_k(\varepsilon/\Omega)+\pi\gamma k\Omega$")
g.writeEPSfile()
g.writePDFfile()
g.writeSVGfile()

