
PyX — Example: axis/log.py
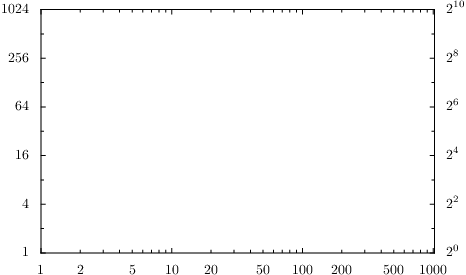
Logarithmic axes
import fractions, math
from pyx import *
from pyx.graph import axis

# we here use parters and texters which are explained in the examples below
log2parter = axis.parter.log([axis.parter.preexp([axis.tick.rational(1)], 4),
                              axis.parter.preexp([axis.tick.rational(1)], 2)])
log2texter = axis.texter.default(base=fractions.Fraction(2))

g = graph.graphxy(width=10,
    x=axis.log(min=1, max=1024),
    y=axis.log(min=1, max=1024, parter=log2parter),
    y2=axis.log(min=1, max=1024, parter=log2parter, texter=log2texter))

g.writeEPSfile("log")
g.writePDFfile("log")
g.writeSVGfile("log")
Description
Logarithmic axes are quite similar to linear axes and differ only in a very few properties, namely a non-linear mapping of values to axis positions. They also have different default partitioners and raters (see below). While the partitioner really is quite different - it implements a logarithmic positioning of the ticks - the rater just alters some defaults in favour of using more subticks to improve the visualization of the logarithmic nature of the axis.
Besides presenting a standard logarithmic axis, we also show you how to alter the base used by the logarithmic axis. Since the functionality of a logarithmic axis is independent of the base, all we need to adjust are the components for creating ticks (see log2parter) and the texts for the labels (see log2texter). More details about the parters and texters components are given below in the corresponding examples.