
PyX — Examples: 3d graphs
3d graphs are created by graphxyz instances. They behave quite similar to regular graphs. Various styles can be used on 3d graphs without further adjustment like the symbol, line, and errorbar styles. Beside that the surface and grid styles are available to handle 3d data defined on a rectangular grid.
Overview for this section
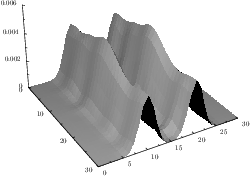
Simple 3d surface
This first simple example provides data for the x, y and z coordinates. PyX creates a rectangular grid from the data from the first two coordinates without relying on a special ordering of the data. more ...
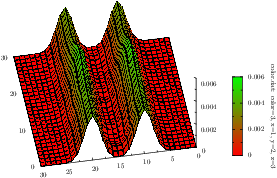
A colored surface
To add colors to the surface you need to pass color data to the plot command. As in this example, you can just reuse the z value. Alternatively you could pass some independend color data. more ...
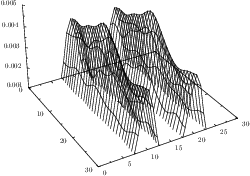
Stroking the grid
The grid as its created by PyX internally can also be stroked by means of the grid style. In this example the minimal value of the z axis was changed too. As lines are cut at graph boundaries properly, this results in a cutted grid. more ...
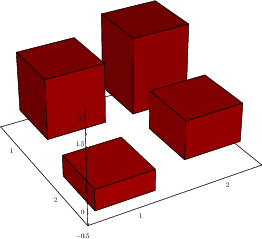
Bar graphs in 3d
The bar style can also be used in 3d graphs.