
PyX — Example: 3dgraphs/bar.py
Bar graphs in 3d
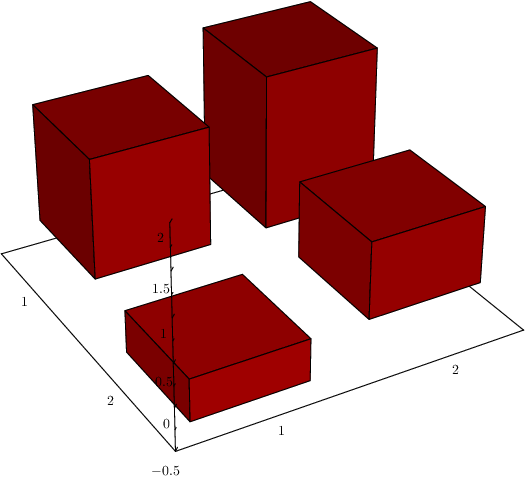
#!/usr/bin/env python
from pyx import *

g = graph.graphxyz(0, 0, size=5, x=graph.axis.bar(), y=graph.axis.bar(), z=None, z2=graph.axis.lin())
g.plot(graph.data.data(graph.data.points([[1, 1, 1.4], [1, 2, 1.8], [2, 1, -0.5], [2, 2, 0.9]]), xname=1, yname=2, z2=3),
       [graph.style.barpos(fromvalue=0, frompathattrs=None), graph.style.bar(barattrs=[style.linejoin.bevel])])
g.writeEPSfile("bar")
g.writePDFfile("bar")
g.writeSVGfile("bar")
Description
The bar style can also be used in 3d graphs.