
PyX — Example: 3dgraphs/grid.py
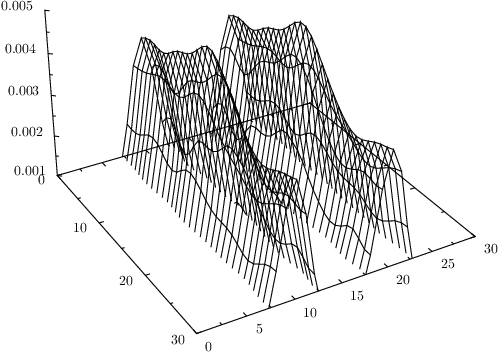
Stroking the grid
#!/usr/bin/env python
from pyx import *

g = graph.graphxyz(size=4, z=graph.axis.lin(min=0.001))
g.plot(graph.data.file("grid.dat", x=1, y=2, z=3), [graph.style.grid()])
g.writeEPSfile("grid")
g.writePDFfile("grid")
g.writeSVGfile("grid")
Description
The grid as its created by PyX internally can also be stroked by means of the grid style. In this example the minimal value of the z axis was changed too. As lines are cut at graph boundaries properly, this results in a cutted grid.
The surface style does not support cuts at the graph boundary. It'll always skip rectangles partially (or fully) outside of the graph.