
PyX — Examples: Bar graphs
In this section we show you the basic features of bar graphs in PyX. All examples shown here use the same data from minimal.dat available for download at the first minimal bar-graph example.
Note that bar graphs differ from other xy-graphs in that they use discrete axes for one graph dimension. However, the only affected components of this fundamental change are one of the axes, which needs to be come a discrete one, i.e. a bar axis, and the usage of appropriate graph styles.
Overview for this section
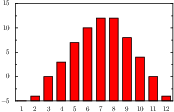
Minimal bar-graph example
For a minimal bar plot you have set an bar axis in the graph constructor and provide Xname column data (X stands for the bar axis to be used). more ...
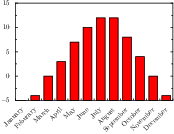
Naming bars
To name the bars you just need to use a proper data column (instead of column 0, which is the line number in data.file instances).
more ...
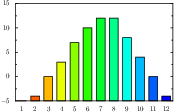
Changing the attributes of the bars
This example is equal to the minimal bar-graph example except for the used style to draw the bars. more ...
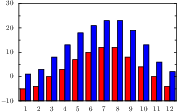
Comparing bars
To draw bars side by side to show differences for the same value you basically need to replace the bar axis by a nestedbar axis and adjust the data to that nesting. more ...
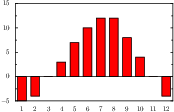
Changing the starting values of the bars
To adjust the value the bars are starting at you need to set a fromvalue at the barpos style.
more ...
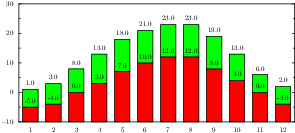
Stack bars on top of each other
To stack bars on top of each other, you can add stackedbarpos styles and further bars to the list of styles. more ...
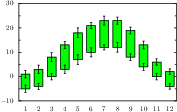
Skipping the first bar in a stacked bargraph
This example shows a bar graph, which starts with a stacked bar skipping to plot the original bar. more ...