
PyX — Example: bargraphs/month.py
Naming bars
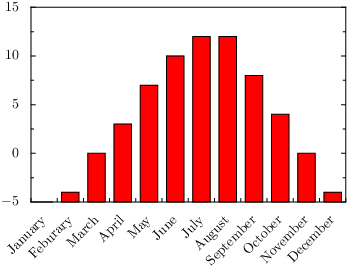
from pyx import *

mypainter = graph.axis.painter.bar(nameattrs=[trafo.rotate(45),
                                              text.halign.right],
                                   innerticklength=0.1)
myaxis = graph.axis.bar(painter=mypainter)

g = graph.graphxy(width=8, x=myaxis)
g.plot(graph.data.file("minimal.dat", xname=1, y=2), [graph.style.bar()])
g.writeEPSfile("month")
g.writePDFfile("month")
g.writeSVGfile("month")
Description
To name the bars you just need to use a proper data column (instead of column 0, which is the line number in data.file instances). Beside that we show in this example how to adjust the bar axis painter to properly show the names.
The internals of a bar axis are quite different from a continuous axis (like a linear or logarithmic) axis. A bar axis just handles a set of subaxes - one for each discrete value. The painting of a bar axis can only draw the names for the subaxes and some ticks between the subaxes. Other axes features known from continous axes like ticks and labels, partitioners, texters, raters are non-existent for bar axes.