
PyX — Example: bargraphs/changebar.py
Changing the attributes of the bars
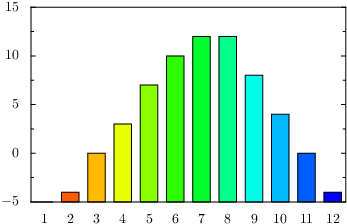
from pyx import *

g = graph.graphxy(width=8, x=graph.axis.bar())
g.plot(graph.data.file("minimal.dat", xname=0, y=2), [graph.style.changebar()])
g.writeEPSfile("changebar")
g.writePDFfile("changebar")
g.writeSVGfile("changebar")
Description
This example is equal to the minimal bar-graph example except for the used style to draw the bars.
It is not possible to use the changebar style to change itself on a list of data as it is shown for the bar style in the comparing bars example.
We are sorry that a graph key implementation for the changebar style is currently missing. The implementation of such a graph key needs a major rework on the whole graph key system. This rework is planned for the near future.