
PyX — Examples: Graph styles
The component architecture of the graph system make graphs highly customizeable. A typical case are personalized graph styles as shown in this section.
Overview for this section
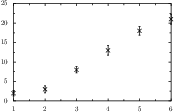
Combining several graph styles
In this example several graph styles are applied one after the other to stroke symbols and errorbars for the given data. This can be achieved by passing a list of graph styles as the second parameter to the graph style. more ...
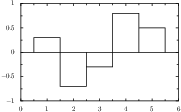
Creating a histogram
Styles can alter the way data is presented in arbitrary ways. Here the histogram style is used to generate a histogram. more ...
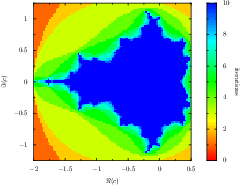
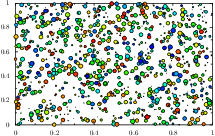
Drawing a density plot
2 dimensional plots where the value of each point is represented by a color can be created by the density style. more ...
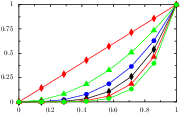
Using the functionality of existing graph styles
This example demonstrates how linestyles, symboltypes, colors, and other decorations can be changed in existing graph styles. more ...
Add functionality to existing graph styles
In this example demonstrate how graph styles can be modified to add further functionality to them. more ...
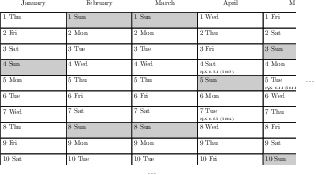
Making a calendar graph
In this example we create a calendar graph style. The style uses bar axes for both graph coordinates and it is a simple and minimal example in the sense that it does not make use of other styles for positioning.