
PyX — Example: axis/parter.py
Parter: Control over the partitioning of the axis
import math
from pyx import *

p = path.curve(0, 0, 3, 0, 1, 4, 4, 4)

myparter = graph.axis.parter.linear(["1/3", "1/6"])

c = canvas.canvas()
c.insert(graph.axis.pathaxis(p, graph.axis.linear(min=0, max=1, parter=myparter)))
c.insert(graph.axis.pathaxis(p.transformed(trafo.translate(4, 0)),
                             graph.axis.linear(min=0, max=1, parter=myparter,
                             texter=graph.axis.texter.rational())))
c.writeEPSfile("parter")
c.writePDFfile("parter")
c.writeSVGfile("parter")
Description
In the above example, the (default) automatic choice of a good partitioning has been selected. Here, we show how to gain more control over the ticks, in order to fix their intervals.
Partitioners (in the code the short form parter is used) take care of calculating appropriate tick positions for a given axis range. Automatic partitioners create several tick lists, which are than rated by an axis rater instance, as explained in the above example. In contrast, manual partitioners create a single tick list only, which thus doesn't need to be rated at all.
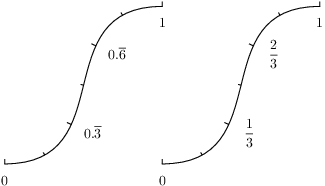
In this example we create a manual partitioner, which places ticks with a distance of 1/3 and subticks with a distance of 1/6. We then use this partitioner at two axis, which are identical except for a texter instance (to show you another feature of the axes in PyX, namely the rational number arithmetics used to place ticks). The rational numbers are preserved throughout the whole process of merging ticks, until the texter finally needs to output the rational numbers. And at the very end the decimal texter steps into the problem to create a proper representation for the fractions. The solution is shown at the left part of the example: the texter marks a period to express the fraction.
Alternatively you can use the rational texter to display the values by fractions directly.