
PyX — Example: graphstyles/usesymbol.py
Using the functionality of existing graph styles
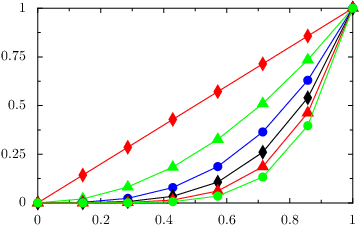
from pyx import *

# colors and symbols to use (alternatingly)
colors = [color.rgb.red, color.rgb.green, color.rgb.blue, color.gray.black]
symbols = [graph.style._diamondsymbol, graph.style._trianglesymbol, graph.style._circlesymbol]

# create the graph styles to be used below
symbol = graph.style.symbol(symbol=attr.changelist(symbols),
                            symbolattrs=[deco.stroked.clear,
                                         attr.changelist([deco.filled([cc]) for cc in colors])])
line = graph.style.line(lineattrs=[attr.changelist(colors),
                                   attr.changelist([style.linestyle.solid])])

g = graph.graphxy(width=8, x=graph.axis.linear(min=0, max=1))
g.plot([graph.data.function("y(x) = x**%d" % i, points=8) for i in range(1, 7)],
       styles=[line, symbol])
g.writeEPSfile("usesymbol")
g.writePDFfile("usesymbol")
g.writeSVGfile("usesymbol")
Description
This example demonstrates how linestyles, symboltypes, colors, and other decorations can be changed in existing graph styles. We make use of the changelist feature as an argument when using a style. Generally, all items in the attribute lists can be iterable changelists. If the end of such a list is reached, the changelist restarts from its beginning (see e.g. the colors which are used several times).
The `attr.stroked.clear' in the symbol deletes the default property of the symbols, which says to stroke the symbol outline.