
PyX — Example: graphstyles/histogram.py
Creating a histogram
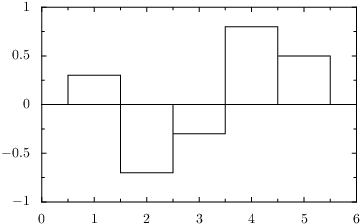
from pyx import *

d = graph.data.points([(1,  0.3),
                       (2, -0.7),
                       (3, -0.3),
                       (4,  0.8),
                       (5,  0.5)], x=1, y=2)

g = graph.graphxy(width=8)
g.plot(d, [graph.style.histogram()])
g.writeEPSfile("histogram")
g.writePDFfile("histogram")
g.writeSVGfile("histogram")
Description
Styles can alter the way data is presented in arbitrary ways. Here the histogram style is used to generate a histogram. By default the histogram draws a box for each histogram value, but you can set the step parameter of the histogram style to use steps instead.
In this basic use-case the histogram is calculated out of equal-spaced x-values automatically. You can also use errorbar like data in one graph dimension to generate histograms with different widths of the histogram boxes.
Note that a histogram is very different from a bar graph in that it uses regular axes (like the default linear axes in this example) in both graph dimensions. Instead, bar graphs use a discrete axis.