
PyX — Example: bargraphs/fromvalue.py
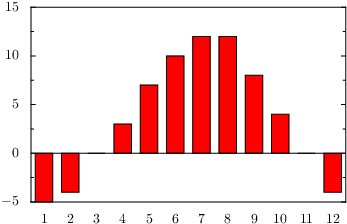
Changing the starting values of the bars
from pyx import *

g = graph.graphxy(width=8, x=graph.axis.bar())
g.plot(graph.data.file("minimal.dat", xname=0, y=2),
       [graph.style.barpos(fromvalue=0), graph.style.bar()])
g.writeEPSfile("fromvalue")
g.writePDFfile("fromvalue")
g.writeSVGfile("fromvalue")
Description
To adjust the value the bars are starting at you need to set a fromvalue at the barpos style. By default the bars start at the baseline not taking into account its value at all.
When setting a barpos style explicitely, no other positioning style instance is needed by the bar style and thus you can set other default values for the barpos style. Note, that as soon as you explicitely set a barpos style, you can also use other styles requesting a point position at the graph (since the bar style also initializes a point position). Hence you could for example replace the bar style in this example by a graph.style.symbol instance.