
PyX — Example: bargraphs/stacked.py
Stack bars on top of each other
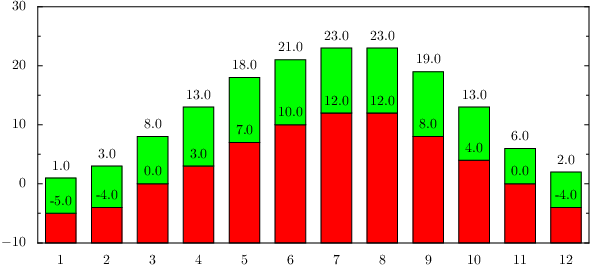
from pyx import *

g = graph.graphxy(width=14, height=6, x=graph.axis.bar())
g.plot(graph.data.file("minimal.dat", xname=0, y=2, stack=3),
       [graph.style.bar(),
        graph.style.text("y"),
        graph.style.stackedbarpos("stack"),
        graph.style.bar([color.rgb.green]),
        graph.style.text("stack")])
g.writeEPSfile("stacked")
g.writePDFfile("stacked")
g.writeSVGfile("stacked")
Description
To stack bars on top of each other, you can add stackedbarpos styles and further bars to the list of styles. The stackbarpos need to get different column names each time to access the new stack data. This example also adds text styles to the bars, which just repeat the value column data here, but they could refer to other columns as well.