
PyX — Example: bargraphs/errors.py
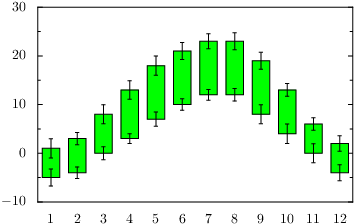
Skipping the first bar in a stacked bargraph
from random import random
from pyx import *

g = graph.graphxy(width=8, x=graph.axis.bar())
g.plot(graph.data.file("minimal.dat", xname=0, y=2, stack=3,
                       dy="1+random()", dstack="1+random()",
                       context={"random": random}),
       [graph.style.errorbar(),
        graph.style.stackedbarpos("stack"),
        graph.style.bar([color.rgb.green]),
        graph.style.range({"y": "stack"}),
        graph.style.errorbar()])
g.writeEPSfile("errors")
g.writePDFfile("errors")
g.writeSVGfile("errors")
Description
This example shows a bar graph, which starts with a stacked bar skipping to plot the original bar. This is done by using stackedbarpos before plotting a bar with the bar style. However you can still add errorbars, even to the lower bound of the bar.
This example also shows how to handle several errorbars in one plot command by the usenames argument of the range style.