
PyX — Example: splitgraphs/splitatvalue.py
Split axis at certain values
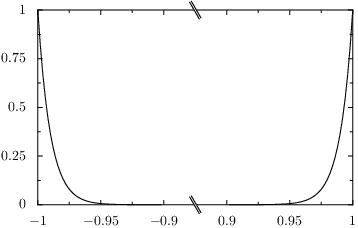
from pyx import *

pf = graph.data.paramfunction

g = graph.graphxy(width=8, x=graph.axis.split())
g.plot(pf("k", -1, 1,
          "x, y = splitatvalue(k, -0.9, 0.9), k**100",
          points=1000))
g.writeEPSfile("splitatvalue")
g.writePDFfile("splitatvalue")
g.writeSVGfile("splitatvalue")
Description
A typical use-case for a split axis is to use some special positions on the axis to mark the axis breaks. For that the splitatvalue function is available in all places, where expressions are evaluated in the graph.data classes. Here we create a special parametric function where split positions for the x axis are added by the splitatvalue function and the y function is a simple polynomial of high order. Note that you can set several split positions by additional parameters of the splitatvalue function. In that case the splitatvalue function marks odd regions to be a "None", by which those data values are ignored by the splitaxis instance.