
PyX — Example: splitgraphs/minimal.py
Minimal split-axis example
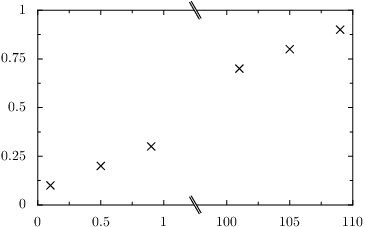
from pyx import *

g = graph.graphxy(width=8, x=graph.axis.split())
g.plot(graph.data.points([((0, 0.1), 0.1),
                          ((0, 0.5), 0.2),
                          ((0, 0.9), 0.3),
                          ((1, 101), 0.7),
                          ((1, 105), 0.8),
                          ((1, 109), 0.9)], x=1, y=2))
g.writeEPSfile("minimal")
g.writePDFfile("minimal")
g.writeSVGfile("minimal")
Description
This minimal example creates a split-axis by two simple modifications. First a splitaxis instance is passed to the graph constructor and secondly the data provided for this axis is modified to contain a tuple of two items. The first item is used as a dictionary key to identify the subaxis, to which the presented data belongs to. The second item in the tuple is used as the value on this subaxis.