
PyX — Example: axis/manualticks.py
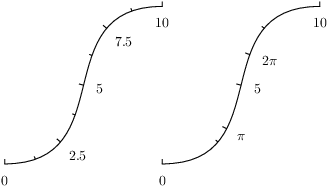
Manually place ticks at certain positions
import math
from pyx import *

p1 = path.curve(0, 0, 3, 0, 1, 4, 4, 4)
p2 = p1.transformed(trafo.translate(4, 0))

myticks = [graph.axis.tick.tick(math.pi, label=r"\pi", labelattrs=[text.mathmode]),
           graph.axis.tick.tick(2*math.pi, label=r"2\pi", labelattrs=[text.mathmode])]

c = canvas.canvas()
c.insert(graph.axis.pathaxis(p1, graph.axis.linear(min=0, max=10)))
c.insert(graph.axis.pathaxis(p2, graph.axis.linear(min=0, max=10, manualticks=myticks)))
c.writeEPSfile("manualticks")
c.writePDFfile("manualticks")
c.writeSVGfile("manualticks")
Description
Ticks can be set manually by passing tick instances to the manualticks argument of the axis instance as shown at the right axis in this example.
As you can see, the manual ticks are combined with the automatically created ticks. You could disable any automatic tick creation by setting the parter argument to None. But what's much more interesting is, that the manually and automatically created ticks are not just merged, but their combination is used for rating the resulting partition. Therefore, the additional manual ticks lead to a different set of automatically created ticks in this example.