
PyX — Example: axis/minimal.py
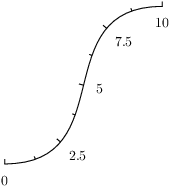
Minimal example for drawing an isolated axis
from pyx import *

c = graph.axis.pathaxis(path.curve(0, 0, 3, 0, 1, 4, 4, 4),
                        graph.axis.linear(min=0, max=10))
c.writeEPSfile("minimal")
c.writePDFfile("minimal")
c.writeSVGfile("minimal")
Description
This is the basic example of how to draw an axis alone -- without the whole graph. It serves to simplify the following examples. The function pathaxis from the graph.axis module takes a path and returns a canvas which contains the drawn axis.
In contrast to the typical usecase of graphs containing data, we here have to provide the range explicitly (using the min and max arguments). For real graphs the range of an axis, of course, is adjusted automatically, although you can still set minimal and/or maximal values to force a certain axis range.