
PyX — Example: axis/painter.py
Painter: Controlling the visual features of an axis
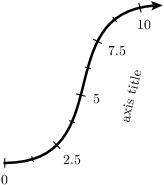
from pyx import *

mypainter = graph.axis.painter.regular(outerticklength=graph.axis.painter.ticklength.normal,
                                       basepathattrs=[style.linewidth.THick, deco.earrow.large])

c = graph.axis.pathaxis(path.curve(0, 0, 3, 0, 1, 4, 4, 4),
                        graph.axis.linear(min=0, max=11, title="axis title", painter=mypainter))
c.writeEPSfile("painter")
c.writePDFfile("painter")
c.writeSVGfile("painter")
Description
The visual features of an axis (such as ticklengths, linewidths, distances of the labels, their orientation, text attributes, etc.) are controlled by its painter. You can modify these attributes by creating a painter explicitly.
While the axis painter has quite some parameters to adjust the output, here we only change its width, add an arrow and alter the ticks: By default, ticks are stroked only towards the inside of the graph (in the path examples there is no graph but don't mind). The labels and the axis title are plotted outside of the graph. Futhermore, the axis title (when present as in this example) is rotated along the axis (without writing it upside down), while the tick labels are not rotated at all.
In this example we set an outerticklength. Together with the innerticklength, which by default is set to the same value, the ticks are stroked across the axis. As it is common to sub-components of the axis, you need to pass the adapted instances (stored in the variable mypainter here) to the axis in its constructor.
In this example there is no tick at the end due to the axis range. You can suppress individual ticks by the manualticks axis parameter with ticklevel and labellevel being zero.