
PyX — Example: graphs/components.py
Shortcut for accessing graph-component attributes
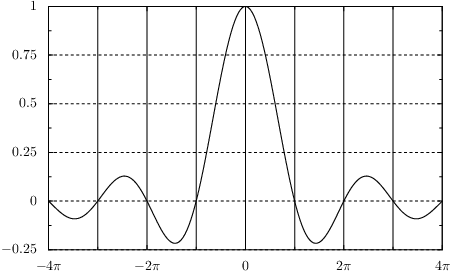
from math import pi
from pyx import *

g = graph.graphxy(width=10,
                  x_min=-4*pi, x_max=4*pi,
                  x_painter_gridattrs=[], x_divisor=pi, x_texter=graph.axis.texter.rational(suffix=r"\pi"),
                  y_painter_gridattrs=[attr.changelist([style.linestyle.dashed, None])])

g.plot(graph.data.function("y(x)=sin(x)/x", points=200))

g.writeEPSfile()
g.writePDFfile()
g.writeSVGfile()
Description
Changing attributes of graphs requires one to set attributes of various graph components. In order to simplify this, PyX provides a shortcut in the constructors of these components. A simple example is the following code snippet, which turns on the x-axis grid in a graph:
graph.graphxy(x=graph.axis.lin(painter=graph.axis.painter.regular(gridattrs=[])))
The same effect can be obtained by the much shorter version
graph.graphxy(x_painter_gridattrs=[])
Here, the hierarchy of components used in the graphxy constructor is indicated by underscores. The part before the first underscore denotes the axes to be modified. In this example, this is the x-axis. The second part defines the component of this axis which should be changed. Here, this is the axis painter. Note that the base for this change is the x-axis of the graphxy, which in the present case is the default value graph.axis.lin. Finally, the third part defines which attribute of the component should be set. In the example, we enable the grid by setting gridattrs to a value different from None. Again, this change assumes that the default painter graph.axis.painter.regular is used.
If you want to replace a component, you have to set it explicitly. Suppose we want to have a log with a grid. This can be achieved by the following code:
graph.graphxy(x=graph.axis.log(painter=graph.axis.painter.regular(gridattrs=[])))
The same effect can be obtained by the shorter version
graph.graphxy(x=graph.axis.log(), x_painter_gridattrs=[])
or alternatively
graph.graphxy(x=graph.axis.log(painter_gridattrs=[]))
This example demonstrates this shorter form of graph-component attributes setting and produces the same result as the example Drawing a graph with grid lines.