
PyX — Example: graphs/grid.py
Drawing a graph with grid lines
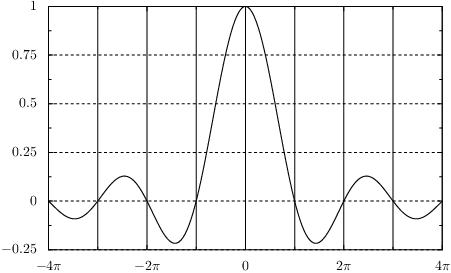
from math import pi
from pyx import *
from pyx.graph import axis

xgridpainter = axis.painter.regular(gridattrs=[])
ygridpainter = axis.painter.regular(gridattrs=[attr.changelist([style.linestyle.dashed, None])])

g = graph.graphxy(width=10,
                  x=axis.lin(painter=xgridpainter,
                             divisor=pi, texter=axis.texter.rational(suffix=r"\pi"), min=-4*pi, max=4*pi),
                  y=axis.lin(painter=ygridpainter))

g.plot(graph.data.function("y(x)=sin(x)/x", points=200))

g.writeEPSfile()
g.writePDFfile()
g.writeSVGfile()
Description
The drawing of grid lines is performed by the axis painters of the graph. In order to turn on a grid, one has to specify in the argument gridattrs a list of attributes defining the way the grid should look like. In order to enable a grid at the position of the axis ticks and subticks, it is enough to set gridattrs to an empty list. In the example, this is done for the grid corresponding to the x-axis. If one wants to control the style of the grid lines or even turn them off selectively for the main or subticks, one can pass attr.changelist instances in the list. The first item of the argument of this class is then used for the main ticks, the second for the first subticks, and so on. In the example, it is shown how to change the linestyle of the grid at the main tick positions and to turn off the grid for the subticks by setting the correpsonding value in the attr.changelist instance to None.
The example also shows a neat trick how to create an axis with axis labels at fractions of pi. This can be achieved by passing a divisor argument to the axis itself, which means that for the axis handling, all values are divided by the corresponding value. Then, we automatically put ticks at the position of rational number by means of axis.texter.rational and add the missing factor pi at the end of the TeX output.