
PyX — Example: graphs/minimal.py
Plotting data contained in a file
from pyx import *

g = graph.graphxy(width=8)
g.plot(graph.data.file("minimal.dat", x=1, y=2))
g.writeEPSfile("minimal")
g.writePDFfile("minimal")
g.writeSVGfile("minimal")
Description
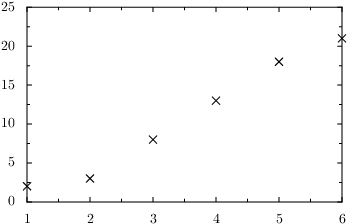
This example shows how to draw a graph representing data stored in a file. We assume that the data is arranged in the file minimal.dat in a whitespace-separated two-column form:
# minimal.dat
1  2
2  3
3  8
4  13
5  18
6  21
The first step is to create an instance of the graphxy class which can be found in the graph module. By convention, we call it g. The constructor expects at least some information about the desired size of the graph. Here, we specify a width of 8 cm.
If we only specify one dimension of the graph size, PyX calculates the other automatically, assuming a ratio corresponding to the golden ratio.
Next, we add some data to the yet empty graph. In order to do so, we first create a graph.data.file instance, which reads the file with the name given as the first argument, i.e., in the present case, "minimal.dat". In addition, we have to specify, how the data is organized in the file. To this end, we use the keyword arguments x=1 and y=2, which tell PyX that the first (second) column of the file contains the x (y) values. The graph.data.file instance is then directly passed to the plot method of the graph g.
Note that PyX by default ignores comments starting by a # sign when reading in the data from the file.
The previous statement is actually not completely correct, as PyX uses the last comment preceding the actual data to give names to the columns. Thus, for a file looking like
# my data (this line is ignored by PyX, but not the following)
# x y
1 2
...
you wouldn't need to label the columns in the graph.data.file call at all.
Finally, we write the graph to an EPS and PDF file. Here, we use that every graph is (by inheritance) an instance of the canvas class, as well, such that we can directly write it into a file.
Of course, you can also insert a graph into another canvas and write this canvas later to a file. This way, you can, for instance, easily arrange more than one graph on a page. Later examples will make use of this fact.
In PyX, the way data is plotted in a graph is defined by a so-called graph style. A couple of standard graph styles are contained in the module graph.style. Depending on the data source, PyX chooses a default style. Here, we are taking the data from a file and PyX assumes that the values represent a discrete set of data points. Hence, it chooses the symbol style graph.style.symbol to plot the data. To override this default behaviour, you can pass a list of styles as second argument to the plot method. For instance, to have PyX drawing a line through the data points, you can use
g.plot(graph.data.file("minimal.dat", x=1, y=2), [graph.style.line()])