
PyX — Example: graphs/function.py
Plotting a function graph
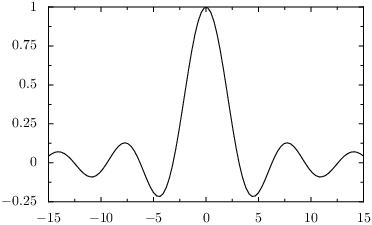
from pyx import *

g = graph.graphxy(width=8)
g.plot(graph.data.function("y(x)=sin(x)/x", min=-15, max=15))
g.writeEPSfile("function")
g.writePDFfile("function")
g.writeSVGfile("function")
Description
Here, we explain how to plot the graph of a real-valued mathematical function of a single real parameter.
As in the previous example, we first create a graph.graphxy instance passing the width as argument. We then pass a graph.data.function instance to the plot method of the graph. As first argument, we pass the function in the form "y(x) = f(x)". Here, the left-hand side of the equation defines which parameter is independent (here: x) and which one is dependent (here: y). We also need to inform PyX about the range of the independent variable. This is done by passing the parameters min and max.
In order to increase the resolution of the function graph, you can use the parameter points of the graph.data.function class to increase the number of sampling points from its default value of 100.
Note that the default graph style for function data is graph.style.line since PyX assumes a continuous x-range.
You only need to pass the min and max parameters to the graph.data.function class, if PyX cannot figure out an axis range by itself. Thus, an alternative way to achieve the above result would look like
g = graph.graphxy(width=8, x=graph.axis.linear(min=-15, max=15))
g.plot(graph.data.function("y(x)=sin(x)/x"))
Here, we explicitely define an x-axis range by passing an appropriate argument to the x parameter of the graph.graphxy class.
For PyX it does not matter, whether you plot a function of a parameter x or a parameter y. Thus, you may as well write
g.plot(graph.data.function("x(y)=sin(y)/y", min=-15, max=15))
to obtain a plot where the y-coordinate is the independent one.