
PyX — Example: graphs/points.py
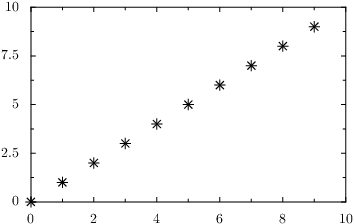
Plotting data contained in one or more lists
# suggested by Chris Spencer

from pyx import *

g = graph.graphxy(width=8)
# either provide lists of the individual coordinates
g.plot(graph.data.values(x=list(range(10)), y=list(range(10))))
# or provide one list containing the whole points
g.plot(graph.data.points(list(zip(range(10), range(10))), x=1, y=2))
g.writeEPSfile("points")
g.writePDFfile("points")
g.writeSVGfile("points")
Description
Here, we explain how to plot data which has been calculated before and which is available in a list.
The procedure is quite the same as for plotting a data file or a function in the above examples. It differs in that we use an instance of graph.data.values or graph.data.points in the plot method of the graph. The choice of one or the other variant depends on convenience and how the data has been generated: In graph.data.values the coordinate values are provided as individual lists. Alternatively, graph.data.points takes a list of data points which come as coordinate tuples. You will then have to say something like x=1, y=2 to specify which entry in your tuples is to be used on which axis.
Similarly to the plotting of a data file, the default plotting style here are symbols.
Caution: This feature has been renamed/introduced between versions 0.9 and 0.10. In versions 0.9 and before the functionality of graph.data.points was provided by graph.data.list.